 Abacalist

 Português
How to use it
From finished trips to the charts.
Finish your trips with prices
Reports use finished trips. Items without a price are left out: add prices so the report is complete.
Open Reports
In the bottom menu, tap Reports.
Pick the period
At the top, choose This month, 3, 6 or 12 months. The total is compared with the previous period.
See the monthly trend
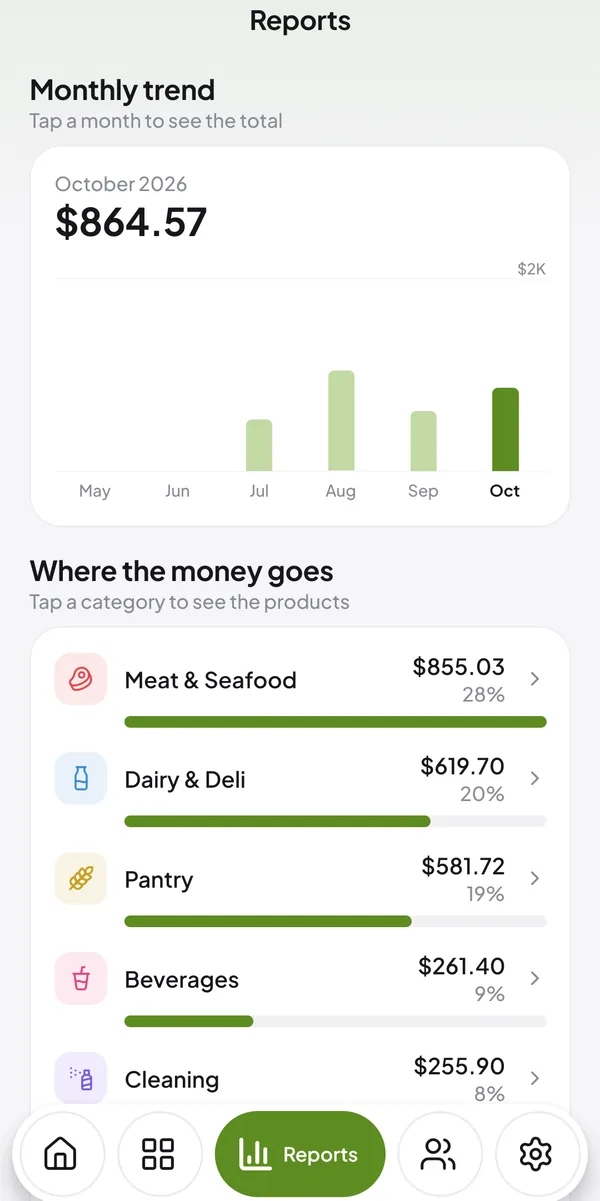
The chart shows what you spent each month. Tap a month to see its total.
Find where the money goes
Spending is split by category. Tap a category to see its products.
Compare stores and products
By store shows how many trips you made to each one and the average. Products that cost you the most shows the top 10 by spending.
Common questions
Quick answers to what people ask most.
Why doesn't a trip show up in the report?
Only finished trips count. Items without a price are left out too.
Can I see spending by store?
Yes. Under By store, see how many trips you made to each one and the average per trip.
Which products cost me the most?
The Products that cost you the most section shows the top 10 by spending in the period.
Read next
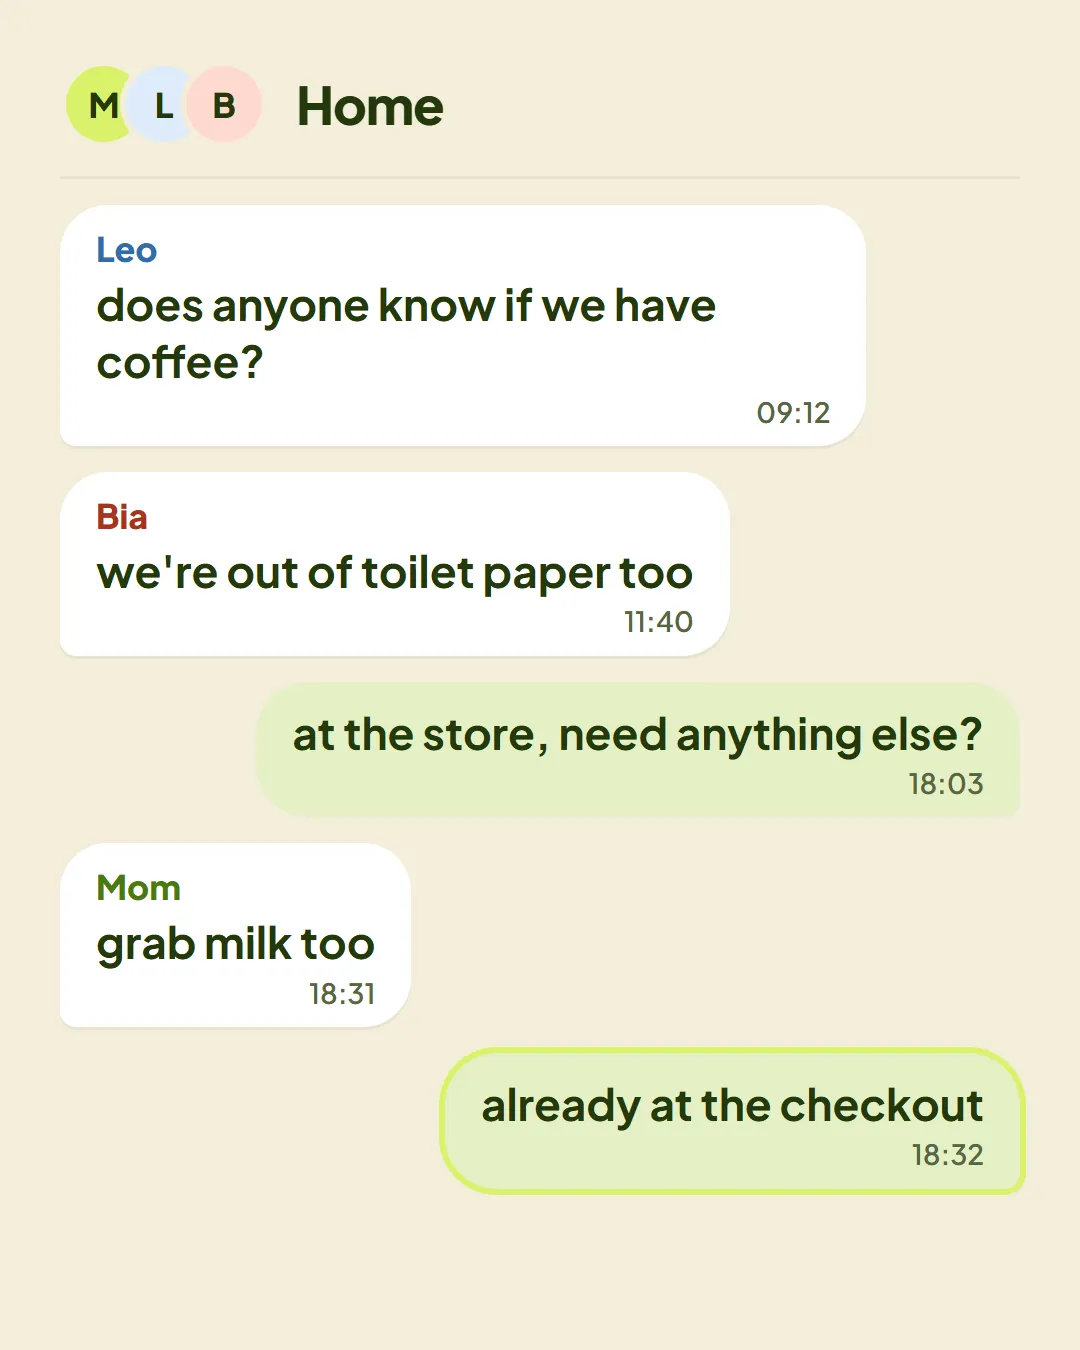
Step 5 of the article is looking at the household's monthly total together.
Article · 2 min readRead →